Maps
Becca and I have bought a couple of antique maps of places we have lived over the years, but we have never got around to getting them properly framed. Well we finally did, and they look awesome!
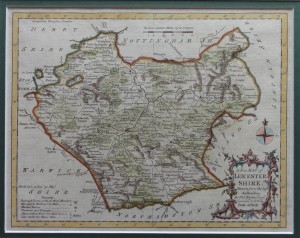
This is a 1764 hand coloured engraving of Leicestershire by Thomas Kitchen.
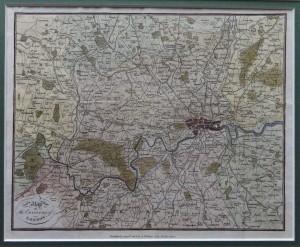
This is a 1806 hand coloured copper engraving of of the Environs of London by R. Phillips of New Bridge Street.

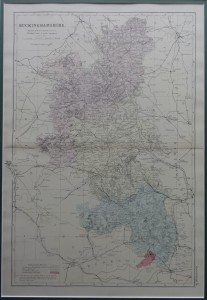
This is a c1880 ordnance survey map of Buckinghamshire by G. W. Bacon. Those sharp witted amongst you will know that we used to live in Milton Keynes, which wasn’t invented (in its current form) until 1967, but Milton Keynes village is just about visible if you know where to look.
We got them framed by out local map shop. Just need to get a nice one of Norfolk and Sri Lanka and we will be done.
ArcGIS 9.3 -> MySQL jiggery pokery
I am finishing up on a project at work called HALOGEN, it’s a cool geospatial platform that I’ve been developing to help researchers store and use their data more efficiently. At its core, HALOGEN has a MySQL database that stores several different geospatial data sets. Each data set is generally made up of several tables and has a coordinate for each data point. Now most of the geo-folk at work like to use ArcGIS to do their analysis and since we have it (v9.3) installed system-wide I thought I would plug it into our database. Simple.
As it happens the two don’t like to play nicely at all.
To get the ball rolling I installed the MySQL ODBC so they could communicate. That worked pretty well with ArcGIS being able to see the database and the tables in it. However, trying to do anything with the data was close to impossible. Taking the most simple data set that consisted of one table I could not get it to plot as a map. The problem was the way ArcGIS was interpreting the data types from MySQL; each and every one was being interpreted as a text field. This meant that it couldn’t use the coordinates to plot the data. I would have thought that the ODBC would have given ArcGIS something it could understand, but I guess not. The work around I used for this was to change the data types at the database level to INTs (they were stored as MEDIUMINTs on account of being BNG coordinates). I know this is overkill, and a poor use of storage etc, but as a first attempt at a fix it worked.
Then I moved on to the more complex data sets made up of several tables with rather complex JOINs needed to properly describe the data. This posed a new problem, since I couldn’t work out how to JOIN the data ArcGIS side to a satisfactory level. So the solution I implemented here was to create a VIEW in the database that fully denormalized the data set. This gave ArcGIS all the data it needed in one table (well, not a real table, but you get the idea).
If we take a step back and look at the two ‘fixes’ so far, you can see that they can be easily combined in to one ‘fix’. By recasting the different integers in the original data in the VIEW, I can keep the data types I want in the source data and make ArcGIS think it is seeing what it wants.
And then steps in the final of the little annoyances that got in my way. ArcGIS likes to have an index on the source data. When you create a VIEW there is no index information cascaded through, so again ArcGIS just croaks and you can’t do anything with the data. The rather ugly hack I made to fix this (and if anyone has a better idea I will be glad to hear it) was to create a new table that has the same data types as those presented by the VIEW and do an
INSERT INTO new_table SELECT * FROM the_view
That leaves me with a fully denormalised real table with data types that ArcGIS can understand. Albeit at the price of having a lot of duplicate data hanging around.
Ultimately, if I can’t find a better solution, I will probably have a trigger of some description that copies the data into the new real table when the source data is edited. This would give the researchers real-time access to the most up-to-date data as it is updated by others. Let’s face it, it’s a million times better than the many different Excel spreadsheets that were floating around campus!
Whisky show 2011
This weekend we went to the whisky show in London, and it was goooood. It was an all-in day ticket that gave us all the free samples we could drink from all the stands, as well as a few nice extras. As part of our tickets we got to have some ‘dream drams’, these are some very nice (read as rare/expensive) tipples to tickle our taste-buds. We wanted to go for the Bowmore 1964 White, but alas it was all gone when we got to the stand. Gutted. Still, the Auchentoshan 1957 went some way to counter my disappointment.
One of the things that got my gastronomic seal of approval was the food pairings with different whiskies. One of their tasters had gone to Borough market and bought some nice nibbles (cheese, sausage, chutney, chocolate etc) and matched them to various whiskies. It really highlighted some of the different aspects of whiskies that I know well, bringing out an almost new flavour to them.
I tried to scribble down the whiskies I tried on the train on the way home and I got a respectable list, there are at least two or three more that I can’t remember the name of.
- Caol Ila Moch
- Caol Ila 25yo
- Lagavulin Distillers edition 1995
- Port Askaig 30yo
- Amrut intermediate sherry matured
- Glengoyne 40yo
- Auchentoshan 1957 (50yo)
- Jameson Vintage
- Bunnahabhain 25yo
- Bunnahabhain 30yo
- Hakushu Bourbon barrel
- Springbank 18yo
- Bowmore 21yo
- TWE Port Ellen x2
- TWE Springbank
- Whisky society Bruichladdich
- Ardbeg 10yo
- Craggenmore 12yo
- Amrut
- Aberlour 10yo
- Caol Ila 12yo
- Mortlach 32yo Cask strength
- Balvenie 12yo
- Mackmyra first edition
I think I shall definitely be making an annual pilgrimage to this!


